

In the previous article on proportional brushing, we explored on how to use Level of details (LOD) expressions to enable use of a dimension field to highlight proportion of dimension fields’ member on another chart.
In today’s article, we will take a different approach for the same results. We’ll be using the newly introduced feature in Tableau 2018.3 called set action.
Once connected to the Superstores data sets.
Step 1: Create view of Sales by Region
Drag dimension field Region to the rows shelf
Drag measure field Sales to the columns shelf

Step 2: Create a set using dimension Region

Step 3: Create view of Sales by Sub-Category
Drag dimension field Sub-Category to the rows shelf
Drag Measure field Sales to the columns shelf
Drag the set created above - Region set - to the color shelf
Add dimension field Region to the details shelf

Step 4: Create a dashboard containing the two views above

Step 5: Add a set action
Under the dashboard menu >> select >>Actions….
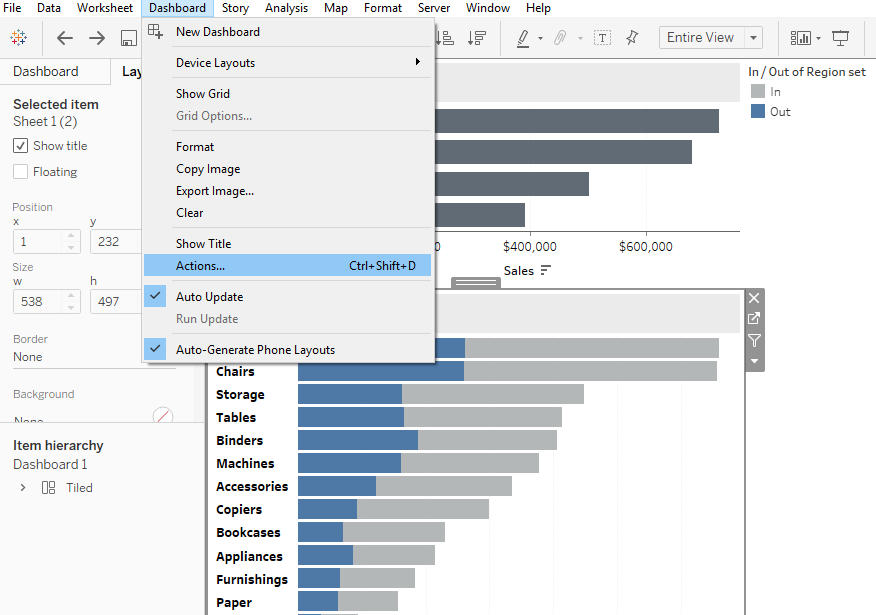
Under Add Action choose >> Change Set Values…

Under Add Set Action menu
Select Source sheet – Sheet 1 for my case – Region view
Run action – Action runs on hovering
Data source – Sample Superstore
Target set – Region set
Behavior on clearing selection – Keep set values

Executing this we’ve

You will agree with me that this view doesn’t differ in any case from the results of the previous article. I hope it was helpful to you.
To receive more of the Tableau tips and tricks, kindly join our mailing list by subscribing below.
Thank you for reading.