
Guide to Conditional Formatting in Power BI
- Bernard Kilonzo
- 3 days ago
- 3 min read

Overview
Conditional formatting is a feature often found in spreadsheet programs like Microsoft Excel, Google Sheets and other data analytics and reporting tools. It allows you to automatically format cells (like changing their color, font, or style) based on specific rules or conditions that you set – helping users quickly identify trends, patterns, or outliers in their data, making it easier to analyze and interpret large datasets.
This article explores the different ways you can format tables and matrixes in Power BI using options such as.
Formatting background color & font color.
Adding data bars.
Adding icons and shapes.
1. Formatting Background and Font Color
To demonstrate this, I have created a matrix showing Profit by Sub-Category and Year as shown below.

Without conditional formatting – it can be difficult and time consuming to interpret the table. However, adding conditional formatting such as background color or font color can speed up the process enabling users instantly spot trends and patterns in the data.
To format the table.
Select the matrix visualization.
In the visualization pane, right-click on Sum of Profit.
Select Conditional formatting >> Background color.

On the dialogue box, customize or format the table as per your needs. (In this example, I have applied “red” – for the lowest values, “green” – for the highest values, and “gray’ - for the middle values)

Executing the above formats the background color of the table as shown below.

Note: You can also format the background color using a set of rules rather than color gradient. To do so, repeat the same procedure and select “Rules” under format styles.
Set the rules as per your needs. (In this case, I have applied “red” – for unprofitable categories, “yellow” – for categories with profit range between ‘0 - 4999’, and “green” – for most profitable categories with profit range between ‘5000 – 30000’).

Executing the above formats the background color of the table as shown below.

The same procedure applies when formatting the fonts rather than the background.
To do so.
Select the matrix visualization.
In the visualization pane, right-click on Sum of Profit.
Select Conditional formatting >> Font color.

On the dialog box, you can format the table using the available options. In this case I am going to format the table using a set of rules as follows. (Apply “red” – for unprofitable categories, “yellow” – for categories with profit range between ‘0 - 4999’, and “green” – for most profitable categories with profit range between ‘5000 – 30000’).

Executing the above formats the font color of the table as shown below.

Its notable from the above three examples, that applying background color or font color makes the data table more interpretable – enabling users instantly spot trends and patterns in the data.
2. Adding Data Bars
Alternatively, you can format the table using data bars as follows.
Select the matrix visualization.
In the visualization pane, right-click on Sum of Profit.
Select Conditional formatting >> Data bars.

On the dialog box, you can format the table using the available options. In this case, I have set the “positive bar” – to green color and the “negative bar” – to red color as shown below.

Executing the above adds colored data bars to the table as shown below – enabling users instantly spot trends and patterns in the data.

3. Adding Icons and Shapes
Following the same procedure, you can incorporate icons and shapes in your table as follows.
Select the matrix visualization.
In the visualization pane, right-click on Sum of Profit.
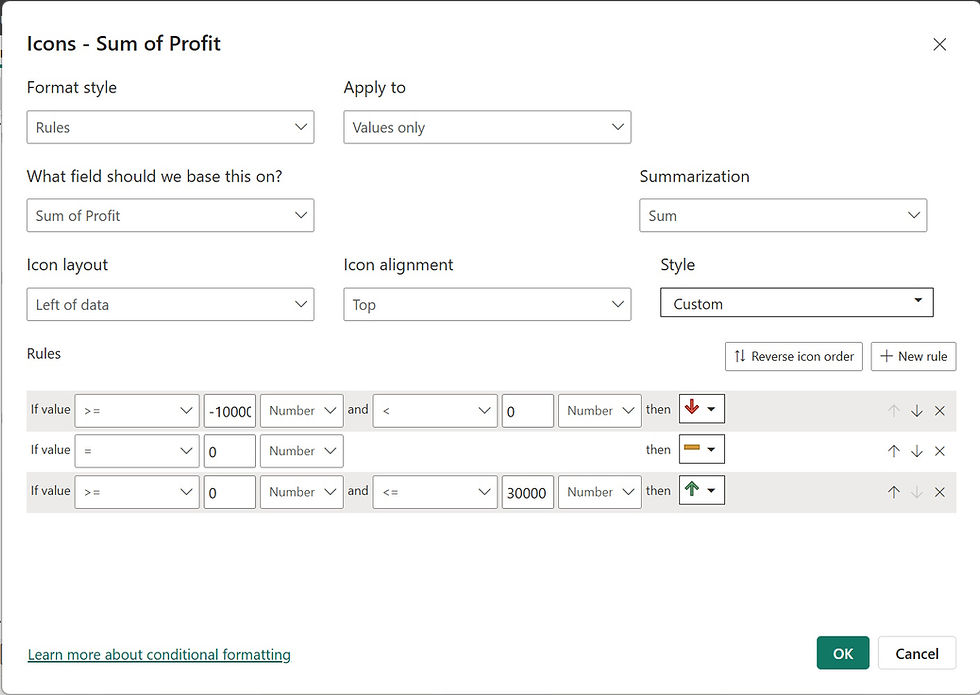
Select Conditional formatting >> Icons.

On the dialog box, format your table using the available options. In this case, I have used downward arrows to represent negative values and upward arrows to represent positive values as shown below.
Executing the above adds colored icons to the table as shown below – enabling users instantly spot trends and patterns in the data.

Conclusion
Conditional formatting in Power BI is a transformative feature that enhances data visualization by enabling dynamic and intuitive insights. By allowing users to apply customized formatting rules, it highlights trends, patterns, and outliers effectively. This not only aids in making data more comprehensible but also accelerates decision-making processes. Whether you're a data analyst or a business professional, mastering conditional formatting in Power BI can significantly amplify the impact of your reports and dashboards. Harnessing this tool ensures your data tells a clear, compelling story.
If you like the work we do and would like to work with us, drop us an email on our contacts page and we’ll reach out!Thank you for reading!