How to Create an Information Icon in Tableau
- Bernard Kilonzo
- Feb 11
- 2 min read

Overview
An information icon is a pictogram displayed on a computer screen to help users navigate and understand various aspects of a system or application. It typically provides additional details or context about an item, feature, or process within the interface. Information icons are often represented by symbols such as "i" in a circle and are used to convey brief, helpful information that may appear when hovered over or clicked.
Example of an Information Icon

Note: You can import an information icon from platforms that provide icons and stickers e.g., Flaticon, or you can create it right in Tableau. In this article, I will share a step-by-step guide on how to create an information icon in Tableau.
How to create an info-icon right in Tableau
To create an info icon in Tableau.
First create a calculated field “Placeholder” as shown below.

Drag the above calculation to the rows shelf.
Change marks card to shapes and select a circle.
Format the view by removing the unnecessary lines.

Create another calculation called “Info Icon” as shown below.

Note: The content of this calculation is simply a letter ‘i’ which will be used as a label.
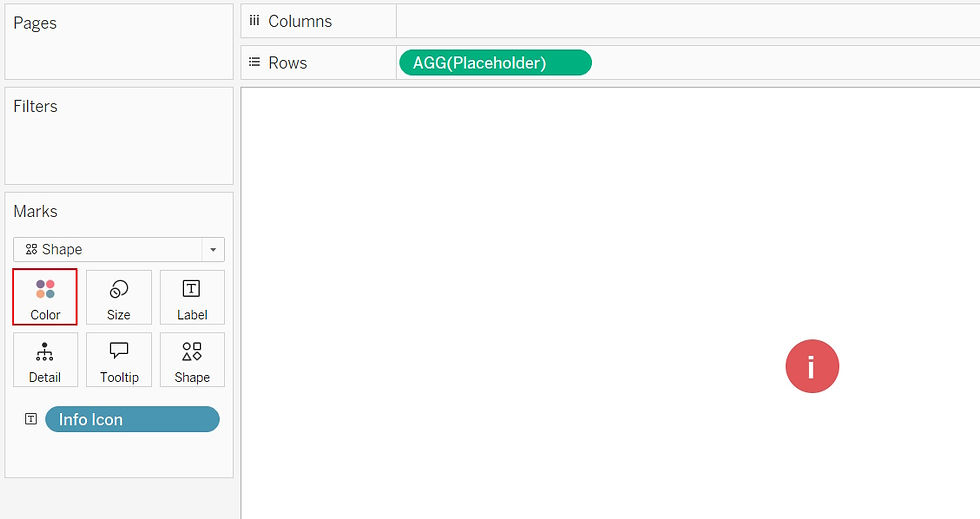
Drag the above calculation to the label shelf and align it to middle center as shown below.

Note: You can customize the color of the info icon by going to the colors shelf.

Note: You can use a different variation of the circle from the shape shelf as shown below.

Finally provide the details you would like to communicate to dashboard users through the tooltips.
Simply open the tooltips and provide the details as shown below.

Notice when you hover on the information icon, the details provided on the tooltip appear.

Conclusion
Information icons play a crucial role in enhancing the effectiveness of information dashboards. These visual elements not only improve usability by providing quick and intuitive navigation but also add visual appeal, making dashboards more engaging and easier to understand.
If you like the work we do and would like to work with us, drop us an email on our contacts page and we’ll reach out!
Thank you for reading!
