What are metrics?
Introduced in Tableau 2020.2, metrics are a type of content which is fully integrated with Tableau’s data and analytics platform through Tableau Server and Tableau Cloud. With Metrics you can track data points from any number of dashboards in a single location – without the need to build a dedicated dashboard tracking your KPIs which could be time-consuming. Metrics are optimized for Tableau mobile – and therefore you can monitor your data on the go with Tableau Mobile App. Another benefit of metrics is that they update automatically – displaying the most recent data. Meaning if you’ve multiple dashboards that you frequently check, you can create metrics for key values from those dashboards so you can be able to monitor them all at once from the Tableau Pulse.
So, what is Tableau Pulse?
Tableau Pulse is a reimagined data experience built on the Tableau platform, that empowers users with AI powered insights delivered directly into their workflow – whether it’s in the Tableau Cloud, Slack or Email.
Set up your site (deploy Tableau Pulse)
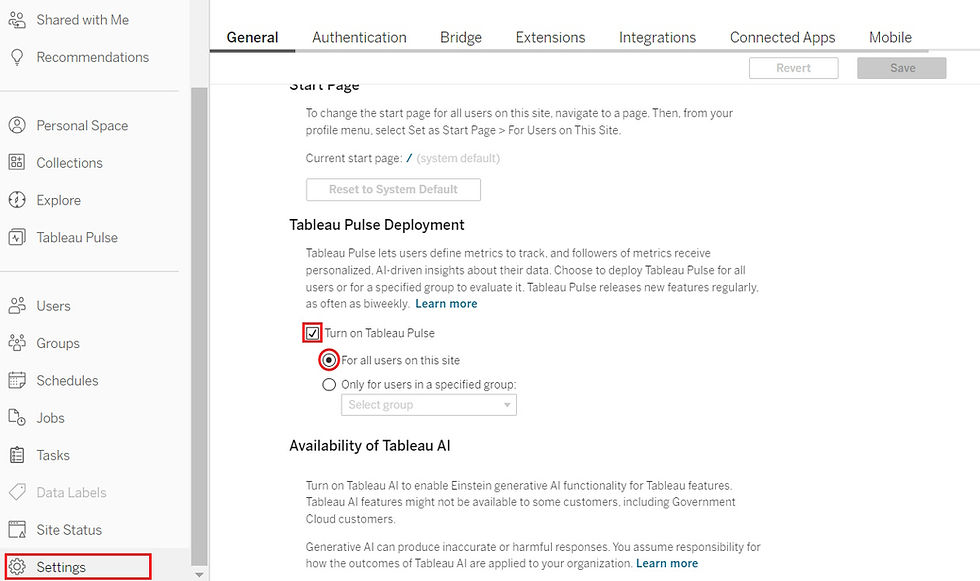
By default, your site settings to deploy Tableau Pulse are turned-off. Meaning, to deploy metrics in your site, you need first to turn the Tableau Pulse settings ON.
To deploy the Tableau pulse, visit the setting page of your site.
From the main Tableau Cloud navigation menu, select Settings (check at the bottom of the navigation menu).
Under Tableau Pulse Deployment, select Turn on Tableau Pulse.
Note, you can turn on the Tableau Pulse for ‘All users on the site’ or ‘for a specified group’.
Once done with your setting select Save.

Once the Tableau Pulse is enabled, it will appear on the navigation menu below the Explore icon.

Data source requirements for metric definitions
Metric definitions are done by connecting to a published data source. Ensure the published data source meets the following criteria.
It’s a single published data source. You can't connect to a data source that is embedded in a workbook, and you can't connect to multiple data sources or use data blending, unless you combine the data before publishing the data source.
You have connect permission capability for the data source.
The data source contains; A measure to be aggregated, a time dimension for the metric’s time series, and at least one dimension that can be used to filter the data and insights.
Create metric definition in Tableau pulse.
Note, to create metric definitions, you need a Creator, Site Administrator Explorer, or Explorer (can publish) site role on the Tableau Cloud. If you’ve a Viewer site role, you can only follow metrics and discover insights.
To create metric definitions,
From the Tableau Pulse homepage, select New Metric Definition (find the button on the top-right section of the view).
Choose the data source to connect and connect it. (In this case I’m using the Sample-Superstore data for the year 2024)
Enter a name for your metric definition (In this case I’m creating a metric definition on Profit).
Add description of the metric, to help others make sense of the data.

Next, choose the measure value to track (in this case Profit).
Set the aggregation (in this case I’m using SUM to aggregate the field Profit).
Next, set how the sparkline will be displayed, whether as a running total or otherwise.
Next, you can add definition filters to limit the metric data (In this case I have left this area blank)
For Time Dimension, select a field to define the time series (for this case, I have selected Order Date)
For Compared To, I have set the primary comparison to Prior Period.

Lastly, let’s add some Adjustable metric filters - these filter options will appear on the metrics and allow users to scope the data to meet their needs.

Next, Configure Insights
On the Insights tab,
Select how the change is interpreted when Value is going up – (In this case, I have set the change to be interpreted as favorable when the value is going up).
Under Insight Types, you can adjust the types of insights generated by turning-off some of the insights. Hover on the information icon for description on each insight type.
Lastly verify that your metrics and insights previews are okay and Save Definition.

Follow metric & invite others to follow.
With the metric set, you can follow it and invite others to follow.

Conclusion
Tableau Pulse metrics allows you to integrate data in your daily workflow – and without the need to learn or build new visualizations, it helps you go beyond the how and what and shows you the why behind your data.
I hope this article was helpful to you. If you wish to receive more Tableau tips and tricks, kindly join our mailing list by subscribing below.
If you like the work we do and would like to work with us, drop us an email on our contacts page and we’ll reach out!
Thank you for reading!
